Catching Flies with Honeypots
I’ve been running a honeypot for a few weeks. I feel like I got a few posts of content out of doing it, so this will be the first of a few. In this first, I’ll talk about the honeypot I set up, some technical issues I ran into with it, and how I handled them.
T-Moble TpotCE
I deployed T-Mobile’s Tpotce in AWS. This honeypot checked several boxes for me:
- Easy to deploy
- Isolated
- Internet accessible
- A wide range of honeypot services
- Data Analyzed and Parsed
This diagram spells it out the best:

You have a large number of containerized services with restricted admin access back into the box. All the services log to a subdirectory in /data and those logs are ingested into an ELK stack built into the tool.
Dashboards and Visualizations
T-Mobile really put an amazing amount of work into this. The visualizations that come out of the box are incredible. You get a great overview of thes ervices and can go to individual dashboards per service to get more detailed data. This is the default global dashboard:
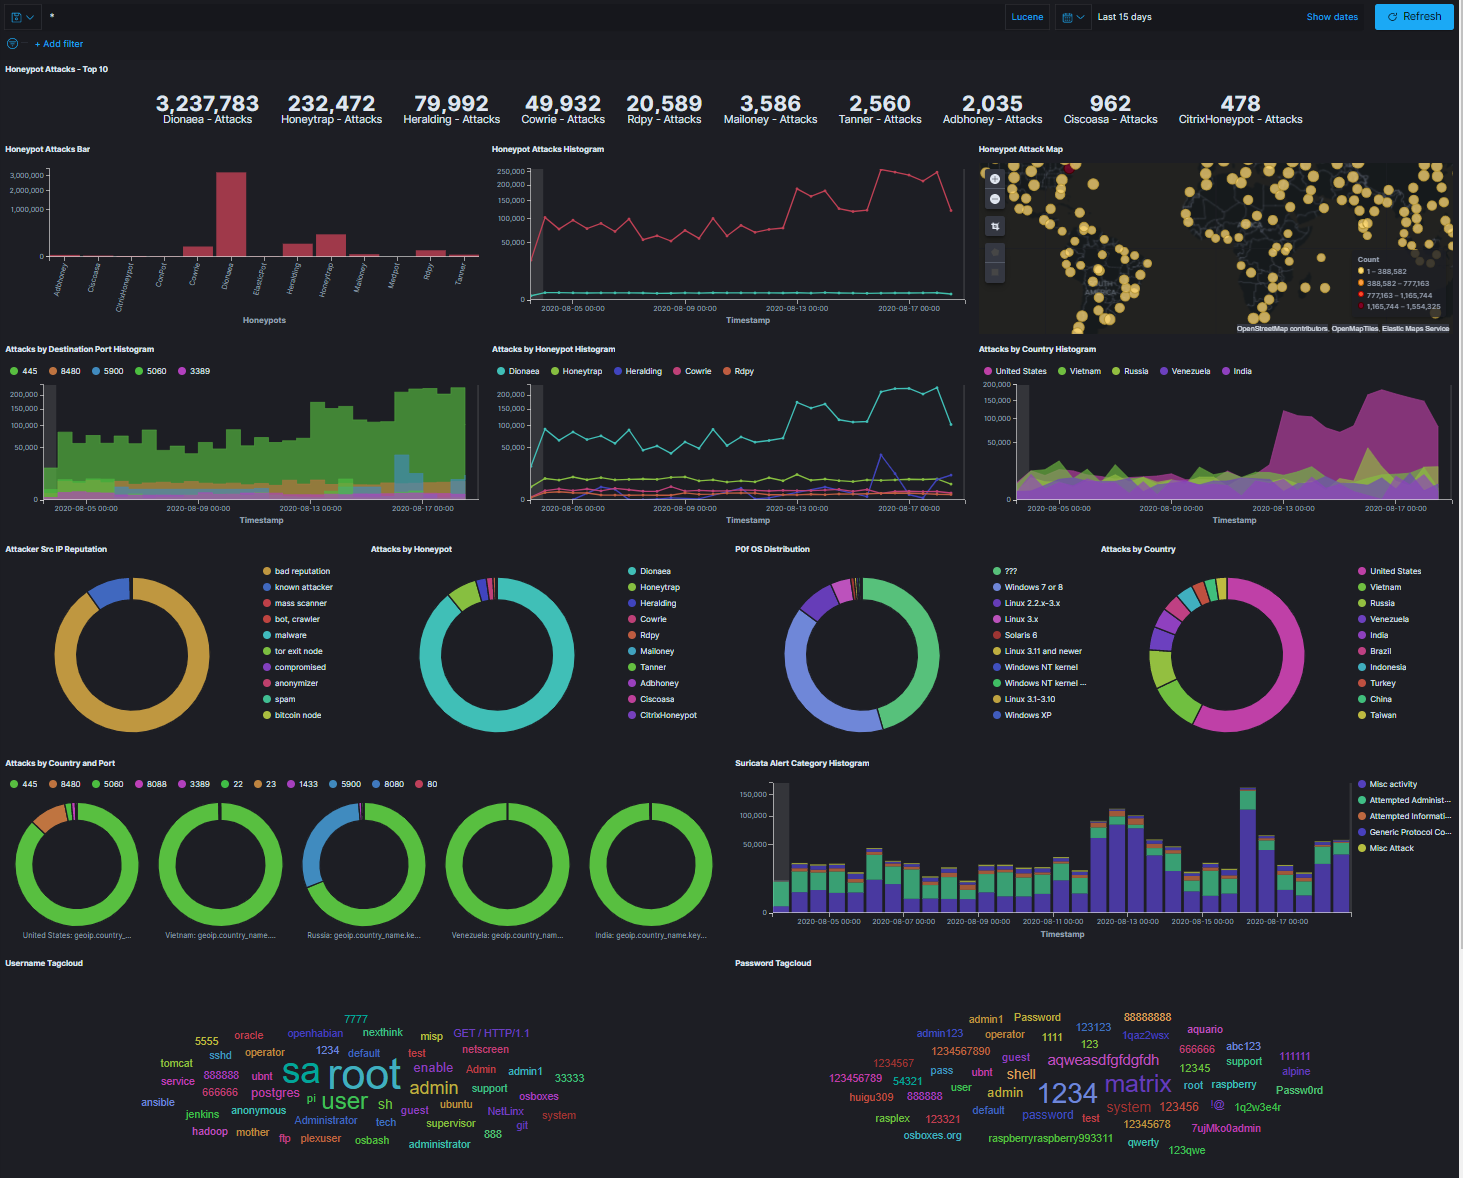
You get a ton of data here, including which ports are being hit the most frequently, which countries most of the attacks are sourced from, and global overviews of counts of attacks per port or service.
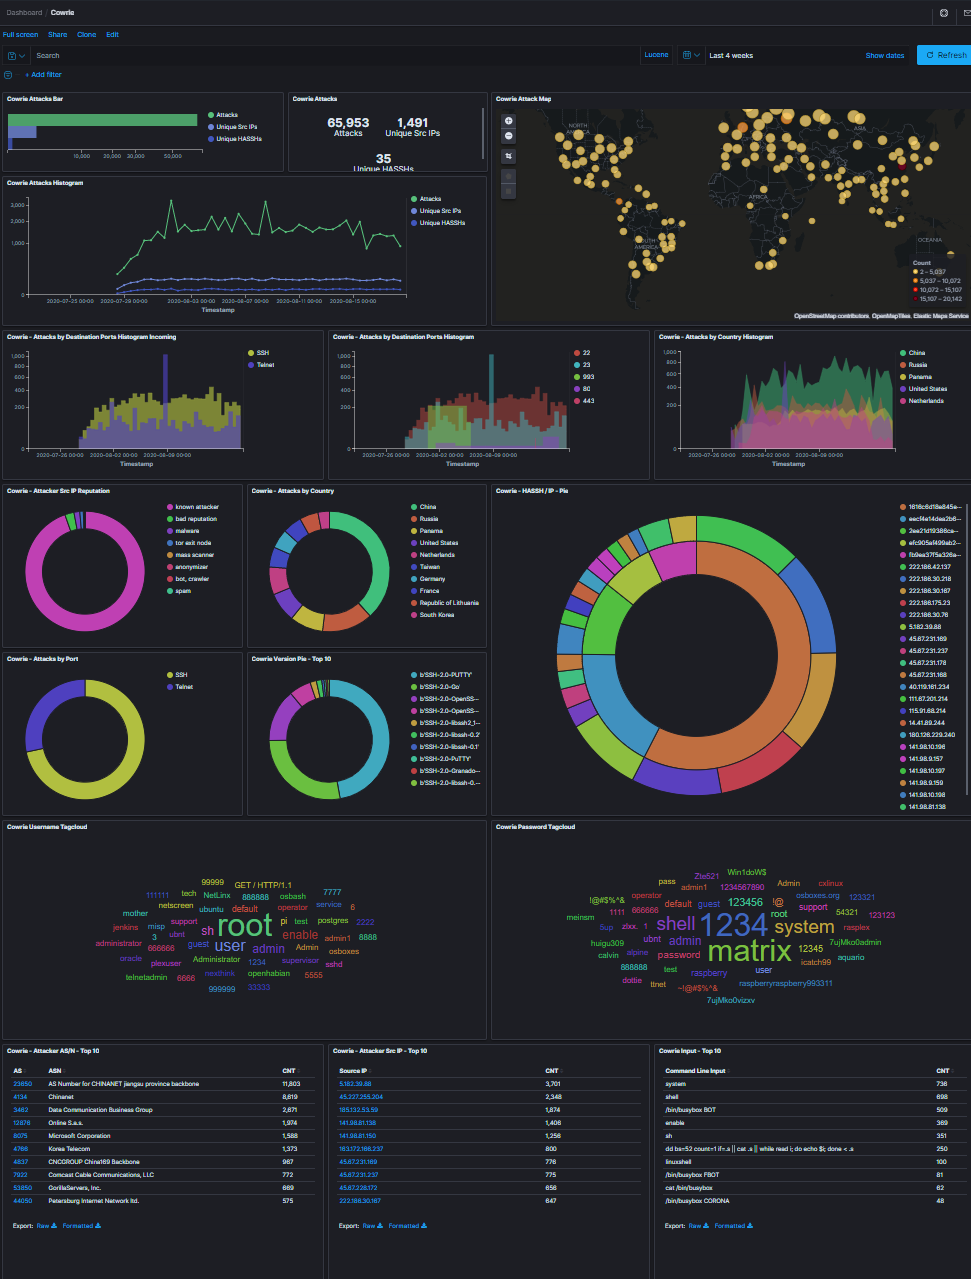
This is the dashboard for one of the most interesting honeypots, cowrie. This is an SSH/Telnet honeypot and what’s great about it is also captures files attackers attempt to upload to it.
Some Snags
I ran into a problem pretty quickly runing this honeypot. After about an hour, I would lose network connectivity to the honeypot. I tried a few basic things to troubleshoot, tinkering with dhcp settings, ipv6 settings, reviewing available default logs, setting systemd to log persistently to disk so I could review logs and reviewing those, and some other stuff. I also found I was not the only one experiencing this issue.
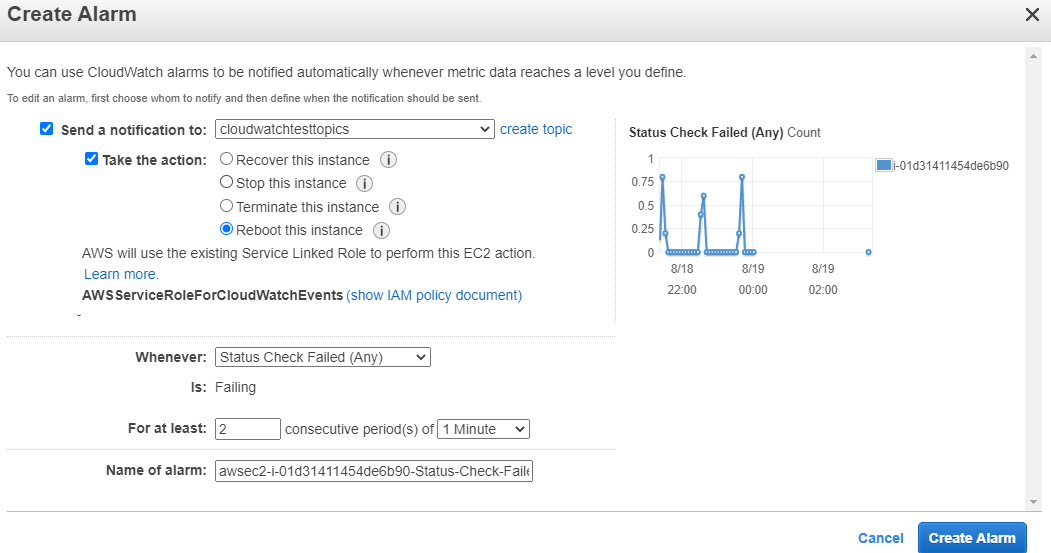
In the end, I enabled AWS system health checks and triggered an automatic reboot. With a health check triggering a reboot every hour after about 2 minutes of downtime, I think I was seeing about 2-4 minutes of downtime each hour. This ended up being good enough for the duration of my testing.
Cost and Other Things
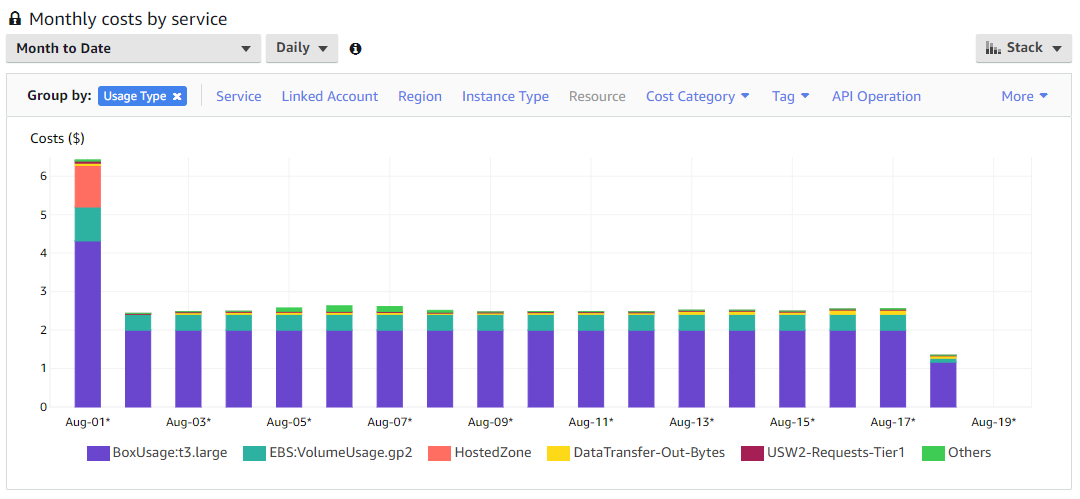
I ran this on the recommended image size, a t3.large instance with Debian 10 as the OS. The cost ended up being about $2.50 a day, which isn’t that bad for all the data I collected. I don’t think you’d want to run this on anything smaller as it is likely to get starved for resources and crash. I tried it on a t3.small and it struggled beyond the point of usefulness. My recommendation is to run it for a set period of time within your budget, snapshot and export the image, and then keep it offline for analysis.
This is a snapshot of my billing dashboard. After the initial spike from monthly recurring costs (unrelated to this project, mainly DNS stuff), costs are pretty steady. While the instance itself costs only 2 bucks a month, I paid another 40 cents per month on top of that for the 128gb EBS volume. Pretty cheap for 2 cores, 8gb ram, and 128gb of disk in the cloud.
Closing Thoughts
This is a really good bang for your buck way to learn what’s out there and what it looks like when it hits an internet facing system. Everywhere I’ve worked has had pretty tightly locked down perimeters and there’s never anything this horrifyingly vulnerable exposed to the internet, so this is a really unique way to get an idea of what the internet looks like from a vulnerable system’s perspective.
For follow up posts, I’ll go through attacks I saw and what the uploaded files tried to do. Thanks for reading!